Margins are influenced by hundreds of decisions across every location.

Understanding their combined impact makes it easier to know what's improving profitability and where to focus next.

Tuesday night sales haven't been uploaded yet — today's food cost may move once they arrive. Upload sales

Revenue

R182k

R13k

Gross margin %

71.4%

1.8pp

Stock variance

R4.4k

R 740

Waste

R1.2k

R 220

What this month cost vs. what it should have

Open variance

Expected COGS

R50k

Based on sales

Actual COGS

R55k

+R5.6k over expected

Healthy spend R50kLogged waste R1.2kUnexplained R4.4k
Open variance

Oat Milk cost up 10%

Projected R 1,480/month impact across 2 drinks.

Espresso Beans variance repeated 3 counts in a row

R 1,260 unexplained in the last 14 days.

Performance across locations

LocationRevenueGross marginStock varianceVarianceWaste
Sea PointNeeds attentionR105k69.8%R2.9kR 720Green Point KioskOn trackR78k73.1%R 620R 460

Variance trend, 8 weeks

5 May – 23 Jun

Improving. Down from 5.8% to 2.4% (R2 920R1 180)

See your business in one place.

Revenue

R182k

R13k

Gross margin

71.4%

1.8pp

Variance

R4.4k

R 740

Waste

R1.2k

R 220

What this period cost vs. what it should have

Open variance

Expected COGS

R50k

Based on sales

Actual COGS

R55k

+R5.6k over expected

Healthy spend R50kLogged waste R1.2kUnexplained R4.4k
!

Oat Milk cost up 10%

Projected R1.5k monthly impact across 2 drinks.

See suggested prices

Operational decisions shouldn't be spread across multiple reports. Yield brings sales, costs, stock loss and operational performance together in one view, making it easier to understand what's affecting profitability across your business.

  • View sales, costs and margin together.
  • Monitor operational performance.
  • Track profitability across every location.
  • Replace multiple operational reports.
Book a demo

Find unresolved losses.

Variance

R4.4k

R 6204.1% of theoretical

Logged waste

R1.2k

R 18026.9% of variance

Unexplained

R2.2k

51.1% of variance

Problems that aren't investigated become recurring problems. Outstanding investigations remain visible, helping your team focus on the actions most likely to improve profitability.

  • Review unresolved investigations.
  • Prioritise outstanding issues.
  • Track investigation progress.
  • Focus on the highest-impact opportunities.
Book a demo

Find winning and losing products

Menu engineering

Each item classified by how profitable it is and how often it's ordered.

Hidden gem
Star
Dog
Workhorse
StarFlat White72.4%24% of orders
StarCappuccino68.9%22% of orders
WorkhorseOat Latte61.2%16% of orders
WorkhorseIced Matcha58.8%14% of orders
Hidden gemAffogato74.1%7% of orders
Hidden gemCold Brew69.7%6% of orders
DogCaramel Frappé44.2%4% of orders

Not every product or location contributes equally to profitability. Compare products, categories and locations to understand what's driving performance and where improvements are needed.

  • Compare product profitability.
  • Compare category performance.
  • Identify high and low performers.
  • Monitor profitability trends.
Book a demo

Measure improvement over time.

Revenue

R182k

R13k

Gross margin

71.4%

1.8pp

Variance

R4.4k

R 740

Waste

R1.2k

R 220

What this period cost vs. what it should have

Open variance

Expected COGS

R50k

Based on sales

Actual COGS

R55k

+R5.6k over expected

Healthy spend R50kLogged waste R1.2kUnexplained R4.4k
!

Oat Milk cost up 10%

Projected R1.5k monthly impact across 2 drinks.

See suggested prices

Operational improvements should produce measurable results. Track operational performance over time to see whether changes are improving profitability or whether more attention is needed.

  • Track KPIs over time.
  • Measure operational improvements.
  • Compare historical performance.
  • Monitor long-term trends.
Book a demo

Find the location that needs your attention

Revenue

R628k

R22k

Gross margin

24.8%

0.4pp

Shrinkage

R9.2k

R 600

What this period cost vs. what it should have

Open variance

Expected COGS

R471k

Based on sales

Actual COGS

R481k

+R9.2k over expected

Healthy spend R471kUnexplained R9.2k
!

Bread and bottled drinks cost more this week

Projected R2.1k monthly impact if shelf prices stay unchanged.

See affected products

Managing multiple locations shouldn't mean managing multiple reports. Yield compares stock, variance, costs and profitability across every location, making it easier to see where management attention is needed first.

  • Compare locations side by side.
  • Identify operational outliers.
  • Benchmark performance.
  • Prioritise management attention.
Book a demo

How Margin Intelligence works.

Sales
Costs
Variance
Waste
Purchasing
What's performing well
What's hurting profit
Where to focus next
Which locations need attention

Rather than reviewing separate reports, Yield gives your team one connected view of the operational decisions affecting profitability.

Manage stock your way.

Whether you sell finished products or make them from raw ingredients, Yield adapts to the way your business manages stock.
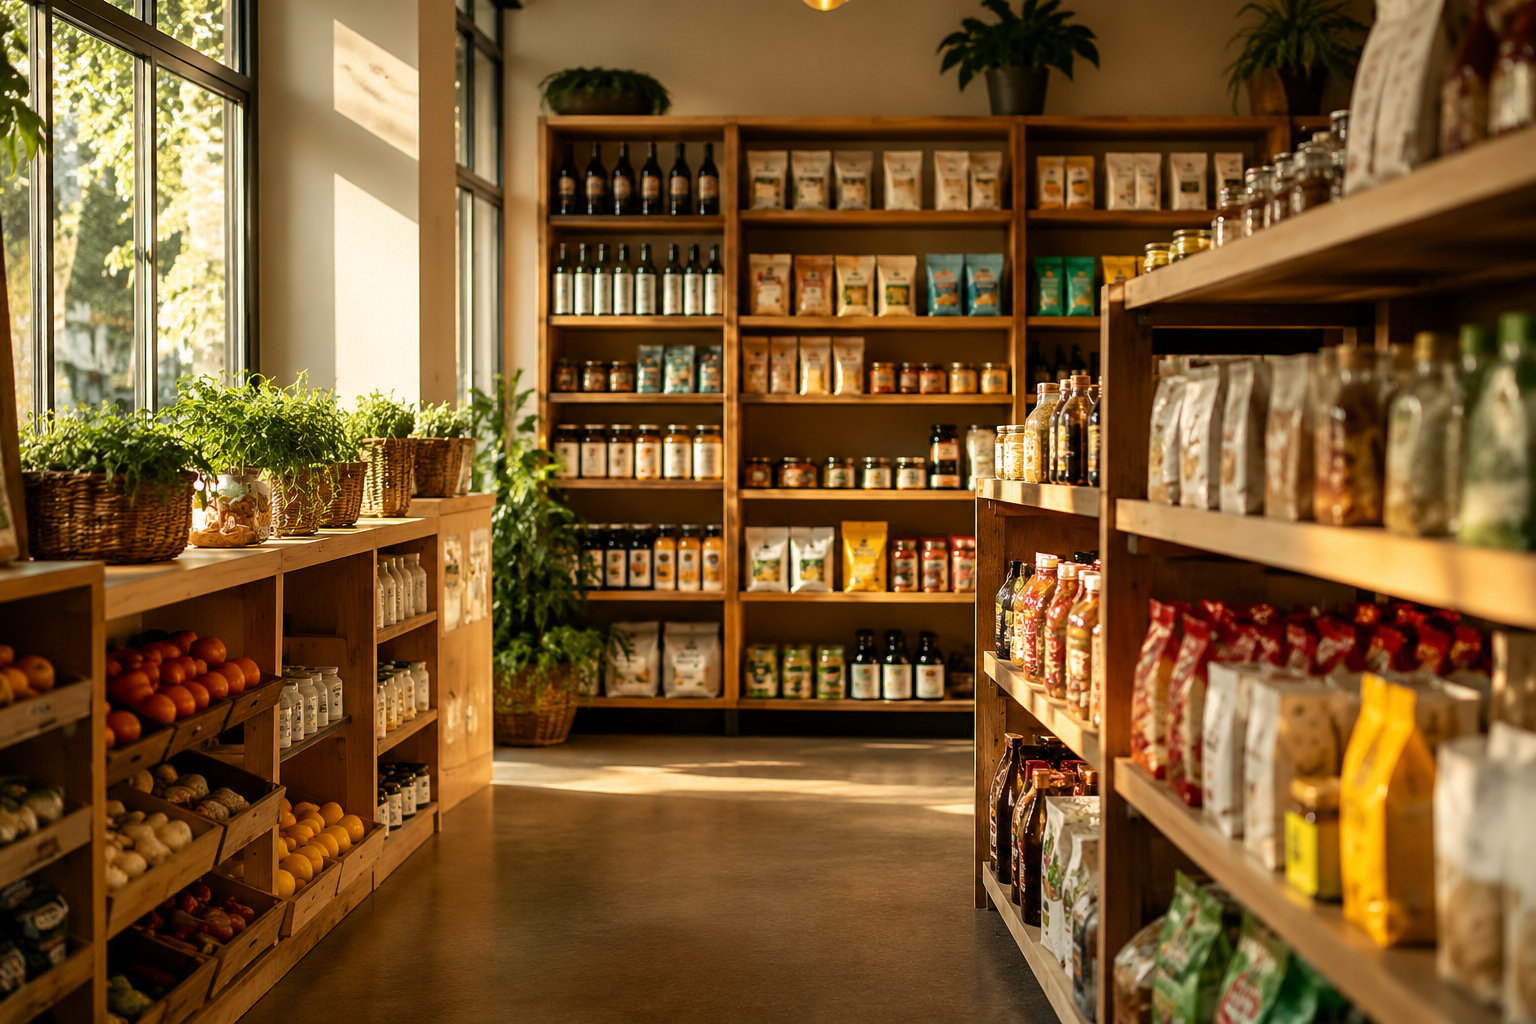
Retail

Reduce shrinkage, respond faster to cost changes and improve product profitability.

  • Compare purchases, sales and stock counts.
  • Identify missing stock before it becomes recurring shrinkage.
  • Know which products drive profitability.
Learn more
Retail

Reduce shrinkage, respond faster to cost changes and improve product profitability.

  • Compare purchases, sales and stock counts.
  • Identify missing stock before it becomes recurring shrinkage.
  • Know which products drive profitability.
Learn more